Resistant bacteria that destroy a drug protect each other only in numbers, so we follow the number of cells instead of a fraction. Then a range of doses has two stable outcomes, cleared and established, and the size of the inoculum decides between them. The range ends at a saddle-node bifurcation, where a stable and an unstable state meet and vanish, and raising and then lowering the dose traces a hysteresis loop.
Counting cells, not fractions
In the shared-good model of Transcritical Bifurcation: Turning the Dose the drug level was set by the fraction of resistant cells, and every dose had exactly one stable steady state: the outcome never depended on where the culture started. In reality the drug level depends on the number of cells that destroy it. Repairing this changes the mathematics, not only the biology.
The inoculum is the number of bacteria at the start of an infection or an experiment. For many antibiotics, penicillins among them, a dose that kills a small inoculum fails against a large one. This is the inoculum effect. One cause is the drug-destroying enzyme β-lactamase. A single cell makes too little of it to protect itself against a high dose. Many cells together destroy the drug in the medium faster than it arrives, and then they survive.
Our example is Mycobacterium tuberculosis, the bacterium that causes tuberculosis (TB). Every TB cell makes its own β-lactamase, called BlaC. The β-lactam meropenem, given together with clavulanate, a drug that blocks BlaC, kills even TB strains that resist every standard drug Hugonnet et al., 2009. Here we give meropenem alone, so the enzyme works. TB grows slowly: a cell divides about once a day.
Three modelling changes follow. We track the number of cells , because the drug level depends on it. There is one strain: every cell makes the enzyme, so the question is whether the population survives at all. And there is no immunity: every cell is killed at a rate proportional to the drug level, and protection comes only from lowering that level for everyone.
The drug level obeys a balance equation, as in Rates In, Rates Out:
Drug is supplied at a constant rate (an infusion, or the inflow of a culture vessel), cleared at rate (each molecule is removed with the same chance per unit time), and destroyed at rate (each cell destroys drug in proportion to its level, which assumes that the enzyme is far from saturated).
Without drug the cells grow logistically with growth rate and carrying capacity , as in Populations and Fractions. The drug kills each cell at rate , as it killed the sensitive cells there:
Meropenem is cleared from the blood with a half-life of about an hour, while a TB population needs about a day to double. So we let the drug sit at its steady state for the current . Setting in (1),
is the drug level without cells. is the number of cells that destroy drug exactly as fast as clearance removes it; at the drug level is halved.
Replacing by its steady state for the current is the quasi-steady state approximation; the next remark shows when it is justified. It does not change the steady states: at a steady state of the pair (1), (2), holds anyway. It changes the dynamics, and it is what lets us describe the system by alone, with a phase line.
Remark 1 (Where is the small parameter?)
“An hour against a day” can be made precise. Measure cells against the carrying capacity, drug against the drug-free level, and time in cell generations: , , . Then (1) and (2) become
with . The small parameter is the growth rate of the cells divided by the clearance rate of the drug. Setting gives , which is (3). The drug relaxes to this value at rate for every , so the reduction is justified whenever is small. A closer analysis of the two-variable system gives three facts:
The bifurcation diagram is exact for every . The full model has the same steady states, and each is a saddle or stable exactly when the phase line of (5) says unstable or stable.
The first correction only slows time. The drug lags behind its target, which multiplies the right-hand side of (5) by a positive factor .
The threshold inoculum depends on the protocol. If the drug starts above its quasi-steady level, for example when cells enter a host that already holds the full dose, the threshold rises above ; if it starts below, it falls. The shift is , the extra kill rate times the time the drug takes to settle.
For TB, /day and meropenem’s half-life of about an hour gives /day, so . The reduction is well justified: at a dose of /day the threshold moves by only about 3% with the protocol. For E. coli, with /h, the same model would give . Facts 1 and 2 would still hold, but the threshold would depend strongly on how the drug is given.
Substitute (3) into (2) and write for the kill rate at the full dose.
Definition 1 (Collective resistance)
with growth rate and kill rate in (per day in the examples), and carrying capacity and in cells per mL.
The model rests on five assumptions, each of which fails somewhere.
Logistic growth. Crowding lowers the per-capita growth rate in proportion to . It fails when growth stops abruptly as food runs out.
Kill proportional to drug. Every cell has the same chance per unit time of being killed, proportional to . Some cells, called persisters, are not killed at any dose.
Unsaturated enzyme. Each cell destroys drug in proportion to , so falls like . At high drug levels each cell destroys drug at a fixed maximal rate instead.
Fast drug. The drug settles faster than the cells change, which leaves one equation and a phase line. It fails for drugs that stay in the body nearly as long as the cells take to divide.
Well mixed. Every cell feels the same drug level. Lung cavities and biofilms are not well mixed.
The tolerated dose
Divide by and put both terms over the common denominator :
The denominator is positive, so the population grows exactly when . is the largest kill rate that a population of cells can withstand; call it the tolerated dose. This gives a graphical method, as the break-even dose did in Transcritical Bifurcation: Turning the Dose: draw the graph of and a horizontal line at height ; the population grows wherever the graph lies above the line.
The steady states solve , so they lie on two curves: the vertical line , which is steady at every dose because an empty culture stays empty, and the graph of . The steady states at dose are the points where the horizontal line at crosses one of these curves.
The picture also gives stability. Differentiate with the product rule; at a crossing the factor vanishes, so
By the slope test (Proposition 1), a crossing where falls is stable and one where rises is unstable, and is stable exactly when .
Remark 2 (The shape of the tolerated dose)
is the product of a rising factor (more cells destroy more drug) and a falling factor (crowding). Since , rises at first exactly when , that is, when cells protect each other before they crowd each other. Without crowding (), only rises and a population above the threshold grows without bound; the logistic factor is what bends down and creates the stable state and the saddle-node below.
For , is a downward parabola with and . Setting gives its maximum,
Three ranges of dose
The line at height meets the parabola in zero, one or two points, and is always a steady state. There are three cases.
: the drug is too weak. The line crosses once, at some . Since , is unstable: even a single cell grows, and every inoculum settles at .
: bistable. The line crosses twice, at . is stable, is unstable and is stable. A single cell is killed, but a large enough population survives: an inoculum below is cleared, and one above settles at . is the threshold inoculum.
: the drug wins. The line lies above the whole graph. Every population is cleared.
The dose that separates the first two cases is the one at which a single cell stops growing. A lone cell destroys too little drug to matter, so this is the dose measured in the laboratory with a small inoculum: the minimum inhibitory concentration (MIC) of Transcritical Bifurcation: Turning the Dose. The middle case is the inoculum effect: a dose above the MIC that still fails against a large inoculum.
import numpy as np
import matplotlib.pyplot as plt
from matplotlib.patches import FancyArrowPatch
from scipy.integrate import solve_ivp
plt.rcParams.update({"figure.dpi": 130, "font.size": 9, "axes.spines.top": False,
                     "axes.spines.right": False})
C_EXACT, C_INNER, C_COMP = "#111111", "#D55E00", "#009E73"
C_GREY = "#999999"


def arrow(ax, xy0, xy1, color=C_INNER, lw=1.5, ms=11):
    ax.add_patch(FancyArrowPatch(xy0, xy1, arrowstyle="-|>", mutation_scale=ms,
                                 color=color, lw=lw, zorder=3))


def flow_arrows(ax, f, zeros, lo, hi, at=None, gap=0.03, **kw):
    """Arrows of x' = f(x) between the steady states on [lo, hi]: horizontal
    along y = 0, or vertical at x = at (a phase line inside a bifurcation
    diagram)."""
    pts = sorted(set([lo, hi, *zeros]))
    g = gap * (hi - lo)
    for x0, x1 in zip(pts[:-1], pts[1:]):
        if x1 - x0 < 3 * g:
            continue
        u, v = x0 + g, x1 - g
        if f(0.5 * (x0 + x1)) < 0:
            u, v = v, u
        if at is None:
            arrow(ax, (u, 0), (v, 0), **kw)
        else:
            arrow(ax, (at, u), (at, v), **kw)


def mark_states(ax, f, zeros, lo, hi, ms=7):
    """Filled: stable. Open: unstable. Only the sides inside [lo, hi] count."""
    eps = 1e-4 * (hi - lo)
    for z in zeros:
        inward = []
        if z - eps > lo:
            inward.append(f(z - eps) > 0)
        if z + eps < hi:
            inward.append(f(z + eps) < 0)
        if all(inward):
            ax.plot([z], [0], "o", color=C_COMP, ms=ms, zorder=4)
        else:
            ax.plot([z], [0], "o", mfc="white", mec=C_EXACT, ms=ms, zorder=4)


def phase_line(ax, f, zeros, lo, hi):
    ax.plot([lo, hi], [0, 0], color=C_EXACT, lw=1.0)
    flow_arrows(ax, f, zeros, lo, hi)
    mark_states(ax, f, zeros, lo, hi)
    ax.set_ylim(-1, 1); ax.set_yticks([])
    ax.spines["left"].set_visible(False); ax.spines["bottom"].set_visible(False)


c = 0.1                              # cost of resistance in the shared-good model (1/h)
r, K, Nc = 1.0, 10.0, 1.0            # 1/day, 1e8 cells/mL, 1e8 cells/mL
h = lambda N: r * (1 - N / K) * (1 + N / Nc)
Nv = (K - Nc) / 2
a_sn = h(Nv)
F = lambda N, a: N * (h(N) - a) / (1 + N / Nc)


def roots(a):
    """Positive solutions of h(N) = a."""
    z = np.roots([-r / (K * Nc), r * (1 / Nc - 1 / K), r - a])
    return sorted(x.real for x in z if abs(x.imag) < 1e-12 and x.real > 0)


NN = np.linspace(0, 12, 400)
fig, axs = plt.subplots(2, 3, figsize=(7.2, 3.3), sharex=True, sharey="row",
                        gridspec_kw={"height_ratios": [3, 1]})
for j, (a, title) in enumerate([(0.5, r"$a = 0.5 < r$"),
                                (2.0, r"$r < a = 2 < a_\mathrm{sn}$"),
                                (3.5, r"$a = 3.5 > a_\mathrm{sn}$")]):
    ax = axs[0, j]
    ax.plot(NN, h(NN), color=C_EXACT, lw=1.8)
    ax.axhline(a, color=C_INNER, lw=1.2)
    ax.fill_between(NN, a, h(NN), where=h(NN) > a, color=C_COMP, alpha=0.18, lw=0)
    for z in roots(a):
        ax.plot([z], [a], "o", color=C_INNER, ms=4)
    ax.set_ylim(0, 4)
    ax.set_title(title)
    phase_line(axs[1, j], lambda N, a=a: F(N, a), [0] + roots(a), 0, 12)
    axs[1, j].set_xlabel(r"$N$ ($10^8$ cells/mL)")
axs[0, 0].set_ylabel("tolerated dose $h(N)$ (1/day)")
axs[0, 0].text(6.3, 0.7, "grows", fontsize=8, color=C_COMP)
fig.tight_layout();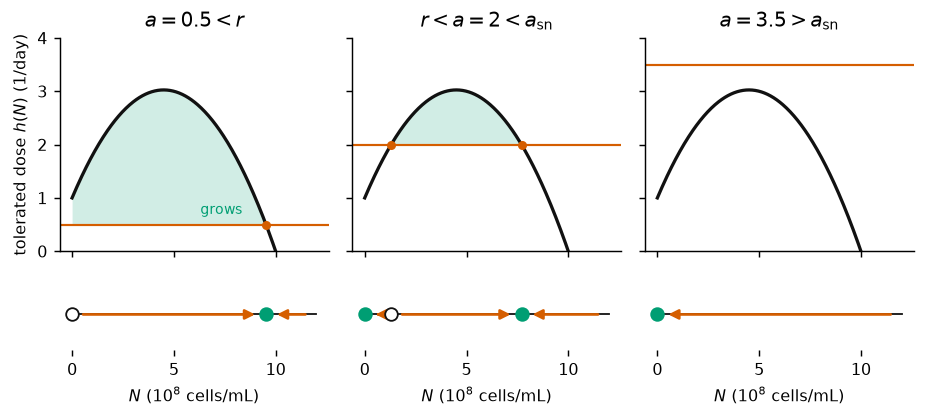
The graphical method for (5). All figures on this page use /day, and , with in 108 cells per mL. Top: the tolerated dose (black) and the dose (orange); the population grows where lies above the line (shaded). Bottom: the phase lines, filled circles stable and open circles unstable. Left: every inoculum grows. Middle: small inocula are cleared and large ones survive. Right: every inoculum is cleared.
The three panels are three heights of one line. Sliding the line up from , a crossing is a steady state, so the phase line can change its picture only at the special heights of the graph:
its value at the boundary state, where the graph meets the line . The two curves of steady states cross there, and a crossing of the dose line passes from one curve to the other;
its turning points, where the line touches the graph and two crossings are born or die together.
Everywhere else the line cuts the graph at a nonzero angle, and a small change of moves each crossing only a little. The tolerated dose has a hump, so it has two special heights, and , and the inoculum model has two bifurcations. If instead (cells crowd each other before they protect each other), Remark 2 shows that falls from to 0 without a hump. Its only special height is : one transcritical bifurcation, no saddle-node, no bistability and no inoculum effect.
a = 2.0
Nm, Np = roots(a)
T = np.linspace(0, 20, 500)
fig, ax = plt.subplots(figsize=(5.4, 2.8))
for N0 in (0.4, 0.9, 1.2, 1.4, 2.0, 4.0, 10.0):
    sol = solve_ivp(lambda _, N: F(N, a), (0, 20), [N0], t_eval=T, rtol=1e-9)
    ax.plot(T, sol.y[0], color=C_EXACT if N0 > Nm else C_INNER, lw=1.3)
ax.axhline(Nm, color=C_GREY, ls="--", lw=1.0)
ax.axhline(Np, color=C_COMP, ls="--", lw=1.1)
ax.text(20, Nm + 0.25, r"threshold $N_-$", ha="right", fontsize=8, color="#777777")
ax.text(20, Np + 0.25, r"$N_+$", ha="right", fontsize=8, color=C_COMP)
ax.set_xlabel("time (days)"); ax.set_ylabel(r"$N$ ($10^8$ cells/mL)")
ax.set_xlim(0, 20); ax.set_ylim(0, 10.5)
ax.set_title("one bistable dose against seven inocula")
fig.tight_layout();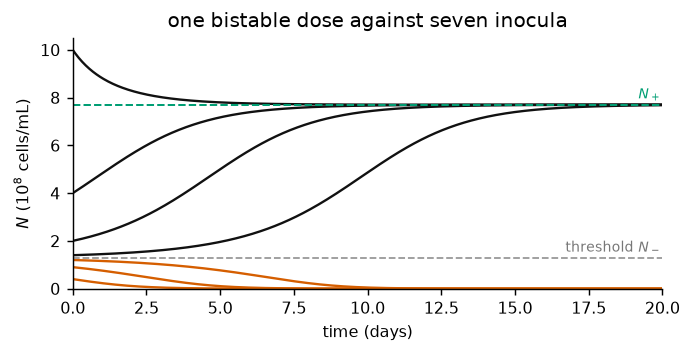
Solutions of (5) at one dose in the bistable range (/day). Inocula below the threshold are cleared (orange); inocula above it grow or shrink to (black). Starting close to the threshold, the population hesitates for days before it decides.
The bifurcation diagram
A bifurcation diagram plots the steady states against the parameter. By (6), exactly when
The first is a branch at every dose. The second gives the dose as a function of the state, the reverse of what the diagram needs, so formally the positive steady states at dose are
is not one-to-one: it rises to its top at and then falls. So it has two inverses, one on each side of the top. The rising part gives a branch and the falling part a branch , and the two meet at when . For this both inverses can be written down. is a parabola with top at and leading coefficient , so
Even without a formula, the graph of is the graph of reflected in the diagonal: plotting the points with across and up turns the graph of on its side. The top of the hump, , becomes the rightmost point of the curve. The curve turns back there, so a dose meets it twice, once, or not at all, exactly as the horizontal line met . By (7), a positive steady state is stable on the upper half of the sideways curve (, where ) and unstable on the lower half (). The branch is unstable for and stable for .
For the lower half continues below . There but , so and the branch is stable. It lies outside the model, since a number of cells cannot be negative, but it is what a transcritical bifurcation requires: on each side of , the branch and the branch through it have opposite stability, and they swap at the crossing. The stability of the sideways curve therefore changes twice: at its turning point, where , and where it crosses , where the factor does. (The formula fails at , where the drug level blows up; the figures stay above that.)
a = 2.0
Nm, Np = roots(a)
NN = np.linspace(0, K, 400)
F_a = lambda N: N * (h(N) - a)
pts = [0, Nm, Np, K + 1]
fig, axs = plt.subplots(1, 2, figsize=(7.2, 3.1))

ax = axs[0]
ax.plot(NN, h(NN), color=C_EXACT, lw=1.8)
ax.plot([0, 0], [0, 3.5], color=C_EXACT, lw=1.8)
ax.axhline(a, color=C_INNER, lw=1.0)
ax.fill_between(NN, a, h(NN), where=h(NN) > a, color=C_COMP, alpha=0.18, lw=0)
for x0, x1 in zip(pts[:-1], pts[1:]):
    u, v = x0 + 0.3, x1 - 0.3
    arrow(ax, (u, a) if F_a((x0 + x1) / 2) > 0 else (v, a),
          (v, a) if F_a((x0 + x1) / 2) > 0 else (u, a), ms=10)
for z, stable in ((0, True), (Nm, False), (Np, True)):
    ax.plot([z], [a], "o", ms=6, zorder=4, **(dict(color=C_COMP) if stable
            else dict(mfc="white", mec=C_EXACT)))
ax.set_xlim(-0.2, K + 1); ax.set_ylim(0, 3.5)
ax.set_xlabel("$N$"); ax.set_ylabel("$h(N)$ (1/day)")
ax.set_title("graphical method: $a$ is a horizontal line")

ax = axs[1]
ax.plot(h(NN), NN, color=C_EXACT, lw=1.8)
ax.plot([0, 3.5], [0, 0], color=C_EXACT, lw=1.8)
ax.axvline(a, color=C_INNER, lw=1.0)
ax.fill_betweenx(NN, a, h(NN), where=h(NN) > a, color=C_COMP, alpha=0.18, lw=0)
flow_arrows(ax, F_a, [0, Nm, Np], 0, K + 1, at=a, gap=0.027, ms=10)
for z, stable in ((0, True), (Nm, False), (Np, True)):
    ax.plot([a], [z], "o", ms=6, zorder=4, **(dict(color=C_COMP) if stable
            else dict(mfc="white", mec=C_EXACT)))
ax.set_xlim(0, 3.5); ax.set_ylim(-0.3, K + 1)
ax.set_xlabel("dose $a$ (1/day)"); ax.set_ylabel("$N$")
ax.set_title("axes swapped: $a$ is a vertical phase line")
fig.tight_layout();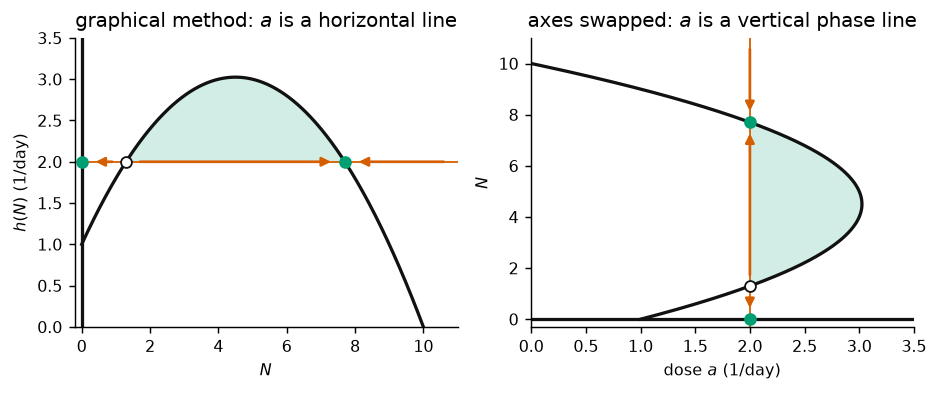
The same picture twice, at one bistable dose (/day). Left: the graphical method, with the arrows of the phase line drawn along the line at height . Right: the axes swapped. The graph of lies on its side, the line at stands up, and its arrows are the phase line at that dose. The branch is the vertical line on the left and the horizontal axis on the right. Repeating the right panel for every dose gives the bifurcation diagram below: the curve is the same for every dose, and only the vertical line moves.
Remark 3 (A first look at nullclines)
The set where , drawn in the plane of and , is called the -nullcline: the curves on which does not change. Here it has two pieces, the line and the curve , and the bifurcation diagram is this nullcline with its stability marked.
Read the plane as a phase plane for two variables, and , where the dose never changes: . Then the flow is vertical everywhere, pointing up on one side of the -nullcline and down on the other, and every point of the nullcline is a steady state. In a genuine two-variable model the second variable has its own nullcline, the flow is no longer vertical, and the steady states are only the points where the two nullclines cross. If the dose changes slowly instead, with small but not zero, the state creeps along a stable piece of the -nullcline and jumps when that piece ends at the fold. That is the hysteresis loop below.
Ns = np.linspace(-0.8, K, 600)
up, dn, neg = Ns >= Nv, (Ns >= 0) & (Ns <= Nv), Ns <= 0


def diagram(ax, color=C_EXACT, alpha=1.0):
    ax.plot(h(Ns[up]), Ns[up], color=color, lw=2, alpha=alpha)
    ax.plot(h(Ns[dn]), Ns[dn], color=color, lw=1.2, ls="--", alpha=alpha)
    ax.plot(h(Ns[neg]), Ns[neg], color=color, lw=2, alpha=alpha)
    ax.plot([0, r], [0, 0], color=color, lw=1.2, ls="--", alpha=alpha)
    ax.plot([r, 4], [0, 0], color=color, lw=2, alpha=alpha)


fig, axs = plt.subplots(1, 2, figsize=(7.2, 3.3), sharey=True)
for ax in axs:
    ax.axhspan(-1.2, 0, color="0.93", zorder=0)
    ax.set_xlim(0, 4); ax.set_ylim(-1.2, 11.2)
    ax.set_xlabel("dose $a$ (1/day)")

ax = axs[0]
Npos = Ns[Ns >= 0]
ax.fill_betweenx(Npos, 0, h(Npos), color=C_COMP, alpha=0.12, lw=0, zorder=0)
diagram(ax)
for a in (0.5, 2.0, 3.5):
    ax.plot([a, a], [0, 11], color="0.85", lw=0.8, zorder=1)
    flow_arrows(ax, lambda N, a=a: F(N, a), [0] + roots(a), 0, 11, at=a,
                ms=9, lw=1.2)
ax.plot([r, a_sn], [0, Nv], "o", color=C_INNER, ms=5, zorder=5)
ax.annotate("transcritical at $a = r$", xy=(r, 0), xytext=(1.125, -0.85),
            fontsize=8, color=C_INNER)
ax.annotate("saddle-node\nat $a_\\mathrm{sn}$", xy=(a_sn, Nv), xytext=(3.125, 5.6),
            fontsize=8, color=C_INNER)
ax.text(2.45, 8.0, "$N_+$", fontsize=9)
ax.text(1.35, 1.8, "$N_-$", fontsize=9)
ax.set_ylabel(r"steady states $N$ ($10^8$ cells/mL)")
ax.set_title("steady states and phase lines")

ax = axs[1]
diagram(ax, color=C_GREY, alpha=0.8)
ax.plot(h(Ns[up]), Ns[up], color=C_INNER, lw=2.2)
ax.plot([r, a_sn], [0, 0], color=C_INNER, lw=2.2)
arrow(ax, (h(8.6), 8.6), (h(7.6), 7.6), ms=12)
arrow(ax, (a_sn, Nv - 0.3), (a_sn, 0.35), ms=12)
arrow(ax, (2.5, 0), (1.8, 0), ms=12)
arrow(ax, (r, 0.35), (r, 8.7), ms=12)
ax.text(1.6, 9.3, "dose up", fontsize=8, color=C_INNER)
ax.text(3.1, 2.0, "collapse", fontsize=8, color=C_INNER)
ax.text(1.7, 0.45, "dose down", fontsize=8, color=C_INNER)
ax.text(0.125, 4.0, "regrowth", fontsize=8, color=C_INNER)
ax.annotate("", xy=(r, 10.7), xytext=(a_sn, 10.7),
            arrowprops=dict(arrowstyle="<->", color="#777777", lw=0.9))
ax.text((r + a_sn) / 2, 10.85, "bistable", ha="center", fontsize=8, color="#777777")
ax.set_title("hysteresis")
fig.tight_layout();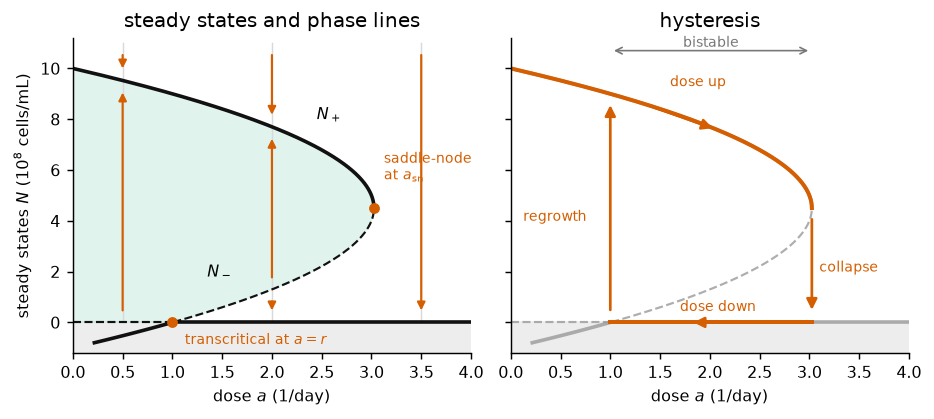
Bifurcation diagram of (5) in the dose . Left: solid curves are stable, dashed unstable, and the population grows in the shaded region inside the sideways curve; the vertical arrows are the phase lines at , 2 and 3.5/day. The unstable branch passes through at (transcritical); below , outside the model (grey), it continues as a stable branch. It meets the stable branch at /day, where both vanish (saddle-node). Right: raising the dose slowly, an established infection follows until and then collapses. Lowering the dose again, it stays cleared until the dose falls below .
The diagram shows the two bifurcations that the special heights of predicted. At the unstable branch passes through and the two exchange stability: a transcritical bifurcation, as in Transcritical Bifurcation: Turning the Dose, except that the branch entering the positive values is now the unstable one, on the side where is stable. At the stable branch and the unstable branch meet at and disappear: a saddle-node bifurcation, also called a fold.
Proposition 1 (Bistability and the inoculum effect)
Let in (5), and let be given by (8).
If , is unstable and every positive inoculum tends to the unique positive steady state .
If , there are two positive steady states . The states and are stable and is unstable. Inocula below tend to 0; inocula above it tend to .
If , every inoculum tends to 0.
There is a transcritical bifurcation at and a saddle-node bifurcation at .
Proof 1
By (6), has the sign of for . is a downward parabola with and maximum at . In case 1, is positive at 0 and has exactly one positive zero , positive before it and negative after. In case 2, is negative at 0, positive between its two zeros , and negative beyond . In case 3, for every . In each case the arrows of the phase line follow. A solution that starts between two neighbouring steady states is monotone and cannot cross either of them, so it converges to the one its arrow points to.
Definition 2 (Transcritical and saddle-node bifurcations)
At a transcritical bifurcation two branches of steady states cross and exchange stability. Neither disappears. At a saddle-node bifurcation a stable and an unstable branch approach each other, meet, and disappear together.
Hysteresis
Follow the right panel. An established infection sits near . Raise the dose slowly. The population follows the stable branch and shrinks, but it stays large almost all the way to the fold. At the branch it was sitting on vanishes, and the population collapses to 0. Now lower the dose slowly. remains stable all the way down to : any cells that survived the collapse, or arrive later, are cleared again. Only below can they grow back. Between and , at the same dose, the population can be either cleared or established, and which one depends on where it came from. This is hysteresis.
Clinically, a dose between the MIC and clears a small inoculum and fails against a large one. There are two ways out: give a dose above , or first lower below the threshold , for example by surgically removing the most heavily infected part of the lung (still done for drug-resistant TB), after which the same dose works. In the diagram the second option moves the state vertically, from the upper branch to below the dashed one.
Karslake and colleagues measured the growth of Enterococcus faecalis at fixed densities under several antibiotics. For most of them the effect of the drug changed with the density; for several the cause was a change in the acidity of the medium, not destruction of the drug. Their models predicted bistable treatment outcomes over a wide range of doses Karslake et al., 2016.
Linearization along the branches
The slope test is a linearization. Near a steady state write with small. Since ,
so : a deviation shrinks if and grows if , on the time scale . Here .
Proposition 2 (Rates along the branches)
Proof 2
An inoculum close to the threshold leaves it at the rate , so it hesitates for a time of order before it decides: that is the hesitation in the solutions above. Near the saddle-node both rates vanish like , so close to the fold every decision is slow.
Reading the bifurcations off the graph
Both models came with a graphical method, the break-even dose of Transcritical Bifurcation: Turning the Dose and the tolerated dose here, and in both the bifurcations sit at the special heights of the graph. rises without a turning point, so its only special height is , and the shared-good model has one bifurcation. has a hump, so it has two, and , and the inoculum model has two. The number of bifurcations can be read off before any diagram is drawn.
fig, axs = plt.subplots(1, 2, figsize=(7.2, 2.8))
ax = axs[0]
P = np.linspace(0, 1 - c / 0.62, 300)
ax.plot(P, c / (1 - P), color=C_EXACT, lw=1.8)
ax.plot([0, 0], [0, 0.6], color=C_EXACT, lw=1.8)
ax.axhline(c, color=C_INNER, lw=1.0, ls="--")
ax.plot([0], [c], "o", color=C_INNER, ms=5)
ax.text(0.05, c + 0.025, "$a = c$: enters at $p = 0$", fontsize=8, color=C_INNER)
ax.text(0.62, 0.22, "$H(p)$", fontsize=9)
ax.set_xlim(0, 1); ax.set_ylim(0, 0.6)
ax.set_xlabel("resistant fraction $p$"); ax.set_ylabel("dose (1/h)")
ax.set_title("shared good: one special height")
ax = axs[1]
NN = np.linspace(0, K, 300)
ax.plot(NN, h(NN), color=C_EXACT, lw=1.8)
ax.plot([0, 0], [0, 3.6], color=C_EXACT, lw=1.8)
for y, lab in ((r, "$a = r$: enters at $N = 0$"),
               (a_sn, r"$a = a_\mathrm{sn}$: touches the top")):
    ax.axhline(y, color=C_INNER, lw=1.0, ls="--")
    ax.text(0.3, y - 0.3 if y == r else y + 0.12, lab, fontsize=8, color=C_INNER)
ax.plot([0, Nv], [r, a_sn], "o", color=C_INNER, ms=5)
ax.text(8.3, 0.5, "$h(N)$", fontsize=9)
ax.set_xlim(0, K + 0.5); ax.set_ylim(0, 3.6)
ax.set_xlabel(r"$N$ ($10^8$ cells/mL)")
ax.set_title("inoculum: two special heights")
fig.tight_layout();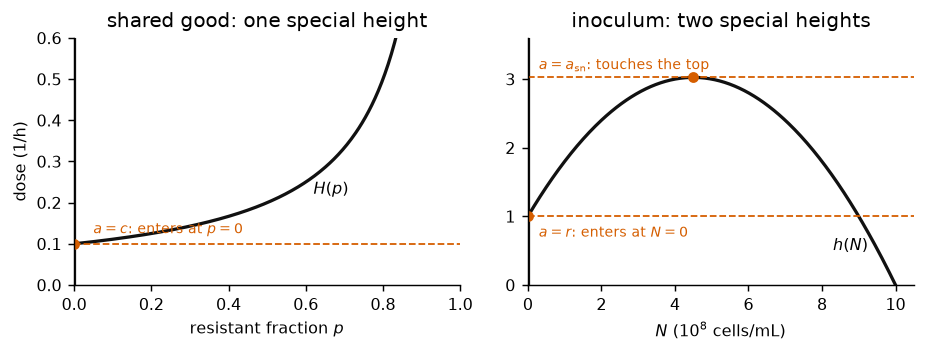
The special heights of the two graphs (dashed): where the line at height meets the boundary state, and where it touches a turning point. Left: the monotone break-even dose , with /h, has one, so the shared-good model has one bifurcation. Right: the hump of the tolerated dose has two, so the inoculum model has two.
Remark 4 (Bifurcations happen where the slope test fails)
In both examples the slope at the steady state involved is zero at the bifurcation value: at , and at . This is no accident. A steady state with moves only a little when the parameter changes a little, and it keeps the sign of its slope, so it neither disappears nor changes stability. To find bifurcations, solve and together. In the graphical method these are the special heights again: by (7), a crossing has exactly when it sits at or at a turning point of .
- Hugonnet, J.-E., Tremblay, L. W., Boshoff, H. I., Barry, I., C. E., & Blanchard, J. S. (2009). Meropenem-clavulanate is effective against extensively drug-resistant Mycobacterium tuberculosis. Science, 323(5918), 1215–1218. 10.1126/science.1167498
- Karslake, J., Maltas, J., Brumm, P., & Wood, K. B. (2016). Population density modulates drug inhibition and gives rise to potential bistability of treatment outcomes for bacterial infections. PLoS Computational Biology, 12(10), e1005098. 10.1371/journal.pcbi.1005098