Some parameters are in our hands: an experimenter chooses the dose of a drug. As a parameter changes, the steady states move, and at special values they appear, disappear, or exchange stability. Such a change is a bifurcation, and at a bifurcation the biology changes its outcome. Turning the dose in the shared-good model and drawing all its phase lines in one picture, the bifurcation diagram, reveals a transcritical bifurcation: it sets the smallest dose at which resistance persists, and near it the culture takes a long time to settle.
The shared-good model at three doses
Return to resistance as a shared good (Definition 2 in Populations and Fractions):
It has two parameters. The cost is set by the cell. The dose, through the kill rate , is set by us. The semicolon in separates the variable , which changes in time, from the parameter , which we hold fixed during an experiment and change between experiments. Hold the cost fixed and turn the dose. There are three cases, according to how the dose compares with the cost.
Below the cost, . The bracket is negative for every in , so and every arrow points left. The formula gives a negative number, not a fraction. The resistant cells are lost: the dose is too small to pay for the enzyme.
At the cost, . The bracket is , and on . The arrows still point left, and is still stable, but : the slope test says nothing.
Above the cost, . As in Example 2, a stable mixture lies inside , and both ends are unstable.
import numpy as np
import matplotlib.pyplot as plt
from matplotlib.patches import FancyArrowPatch
plt.rcParams.update({"figure.dpi": 130, "font.size": 9, "axes.spines.top": False,
                     "axes.spines.right": False})
C_EXACT, C_INNER, C_COMP = "#111111", "#D55E00", "#009E73"
C_GREY = "#999999"


def arrow(ax, xy0, xy1, color=C_INNER, lw=1.5, ms=11):
    ax.add_patch(FancyArrowPatch(xy0, xy1, arrowstyle="-|>", mutation_scale=ms,
                                 color=color, lw=lw, zorder=3))


def flow_arrows(ax, f, zeros, lo, hi, at=None, gap=0.03, **kw):
    """Arrows of x' = f(x) between the steady states on [lo, hi]: horizontal
    along y = 0, or vertical at x = at (a phase line inside a bifurcation
    diagram)."""
    pts = sorted(set([lo, hi, *zeros]))
    g = gap * (hi - lo)
    for x0, x1 in zip(pts[:-1], pts[1:]):
        if x1 - x0 < 3 * g:
            continue
        u, v = x0 + g, x1 - g
        if f(0.5 * (x0 + x1)) < 0:
            u, v = v, u
        if at is None:
            arrow(ax, (u, 0), (v, 0), **kw)
        else:
            arrow(ax, (at, u), (at, v), **kw)


def mark_states(ax, f, zeros, lo, hi, ms=7):
    """Filled: stable. Open: unstable. Only the sides inside [lo, hi] count."""
    eps = 1e-4 * (hi - lo)
    for z in zeros:
        inward = []
        if z - eps > lo:
            inward.append(f(z - eps) > 0)
        if z + eps < hi:
            inward.append(f(z + eps) < 0)
        if all(inward):
            ax.plot([z], [0], "o", color=C_COMP, ms=ms, zorder=4)
        else:
            ax.plot([z], [0], "o", mfc="white", mec=C_EXACT, ms=ms, zorder=4)


def phase_line(ax, f, zeros, lo, hi):
    ax.plot([lo, hi], [0, 0], color=C_EXACT, lw=1.0)
    flow_arrows(ax, f, zeros, lo, hi)
    mark_states(ax, f, zeros, lo, hi)
    ax.set_ylim(-1, 1); ax.set_yticks([])
    ax.spines["left"].set_visible(False); ax.spines["bottom"].set_visible(False)


c = 0.1
f_shared = lambda p, a: p * (1 - p) * ((a - c) - a * p)
shared_zeros = lambda a: [0, 1] + ([1 - c / a] if a > c else [])

fig, axs = plt.subplots(2, 3, figsize=(7.2, 3.1), sharex=True, sharey="row",
                        gridspec_kw={"height_ratios": [3, 1]})
pp = np.linspace(0, 1, 400)
for j, (a, title) in enumerate([(0.05, r"$a = 0.05 < c$"),
                                (0.1, r"$a = c = 0.1$"),
                                (0.5, r"$a = 0.5 > c$")]):
    f = lambda p, a=a: f_shared(p, a)
    ax = axs[0, j]
    ax.axhline(0, color=C_GREY, lw=0.8)
    ax.plot(pp, f(pp), color=C_EXACT, lw=1.8)
    ax.set_title(title)
    phase_line(axs[1, j], f, shared_zeros(a), 0, 1)
    axs[1, j].set_xlabel("resistant fraction $p$")
axs[0, 0].set_ylabel(r"$\dot p$ (1/h)")
axs[0, 0].set_ylim(-0.025, 0.06)
fig.tight_layout();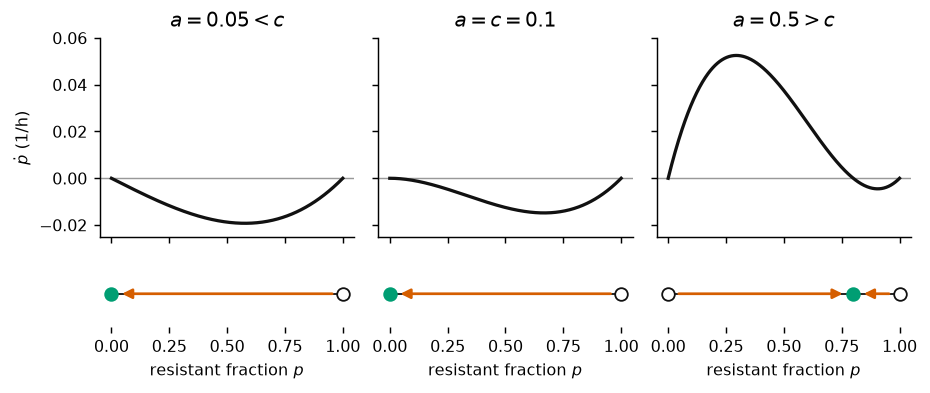
The shared-good model (1) at three doses, with cost /h as in Example 1; all figures on this page use this cost. Top: the right-hand side. Bottom: the phase line, with stable steady states filled and unstable ones open. Below the cost (left) resistance is lost. At the cost (middle) it is still lost, but the graph touches zero at with zero slope. Above the cost (right) a stable mixture has appeared.
Between the first and the third phase line, the stability moved from to a new steady state that was not there before. The rest of this page finds where exactly this happens, and how.
The bifurcation diagram
Instead of drawing phase lines one dose at a time, draw them all in one picture. Turn each phase line so that it stands vertically, and place it at its value of . The steady states of neighbouring phase lines join into curves.
Definition 1 (Bifurcation and bifurcation diagram)
Let depend on a parameter . The bifurcation diagram plots the steady states against , stable states as solid curves and unstable states as dashed curves. A bifurcation happens at a value where the phase line changes its picture: steady states appear, disappear, or change stability. is the bifurcation value.
The steady states of (1) lie on three curves,
and the slopes there are
Reading the signs: is always unstable. is stable for and unstable for . is the other way round: unstable for , where it is negative and not a fraction, and stable for . Both change at , which is exactly where passes through 0.
The break-even dose
We found by solving the bracket for the fraction. Solve it for the dose instead: the bracket vanishes when
is the break-even dose: the dose at which resistant cells at fraction exactly pay for their enzyme. It rises with : the more resistant cells there are, the less drug they leave, so the larger the dose must be for resistance still to pay.
Remark 1 (The graphical method)
Factoring out of the bracket,
so for the resistant fraction grows exactly when the dose lies above the break-even dose. Draw the graph of and a horizontal line at height : grows wherever the line lies above the graph. Swap the axes, and the graph of becomes the branch , while the line at becomes the vertical phase line.
a = 0.3
ps = 1 - c / a
H = lambda p: c / (1 - p)
P = np.linspace(-0.6, 1 - c / 0.62, 400)
grows = (P >= 0) & (H(P) < a)
states = ((0, False), (ps, True), (1, False))
dot = lambda stable: (dict(color=C_COMP) if stable
                      else dict(mfc="white", mec=C_EXACT))
fig, axs = plt.subplots(1, 2, figsize=(7.2, 3.1))

ax = axs[0]
ax.axvspan(-0.6, 0, color="0.93", zorder=0)
ax.plot(P, H(P), color=C_EXACT, lw=1.8)
for x in (0, 1):
    ax.axvline(x, color=C_EXACT, lw=1.2)
ax.axhline(a, color=C_INNER, lw=1.0)
ax.fill_between(P, H(P), a, where=grows, color=C_COMP, alpha=0.18, lw=0)
for x0, x1 in ((0, ps), (ps, 1)):
    u, v = x0 + 0.04, x1 - 0.04
    if f_shared((x0 + x1) / 2, a) < 0:
        u, v = v, u
    arrow(ax, (u, a), (v, a), ms=10)
for z, stable in states:
    ax.plot([z], [a], "o", ms=6, zorder=4, **dot(stable))
ax.text(0.7, 0.2, "$H(p)$", fontsize=9)
ax.text(-0.57, 0.03, "not a fraction", fontsize=7.5, color="#777777")
ax.set_xlim(-0.6, 1.1); ax.set_ylim(0, 0.6)
ax.set_xlabel("resistant fraction $p$"); ax.set_ylabel("$H(p)$ (1/h)")
ax.set_title("graphical method: $a$ is a horizontal line")

ax = axs[1]
ax.axhspan(-0.6, 0, color="0.93", zorder=0)
ax.plot(H(P), P, color=C_EXACT, lw=1.8)
for y in (0, 1):
    ax.axhline(y, color=C_EXACT, lw=1.2)
ax.axvline(a, color=C_INNER, lw=1.0)
ax.fill_betweenx(P, H(P), a, where=grows, color=C_COMP, alpha=0.18, lw=0)
flow_arrows(ax, lambda p: f_shared(p, a), [0, ps, 1], 0, 1, at=a, ms=10)
for z, stable in states:
    ax.plot([a], [z], "o", ms=6, zorder=4, **dot(stable))
ax.text(0.42, 0.62, r"$p^\ast = 1 - c/a$", fontsize=8)
ax.text(0.33, -0.3, "$p < 0$: not a fraction", fontsize=7.5, color="#777777")
ax.set_xlim(0, 0.6); ax.set_ylim(-0.6, 1.1)
ax.set_xlabel("dose $a$ (1/h)"); ax.set_ylabel("$p$")
ax.set_title("axes swapped: $a$ is a vertical phase line")
fig.tight_layout();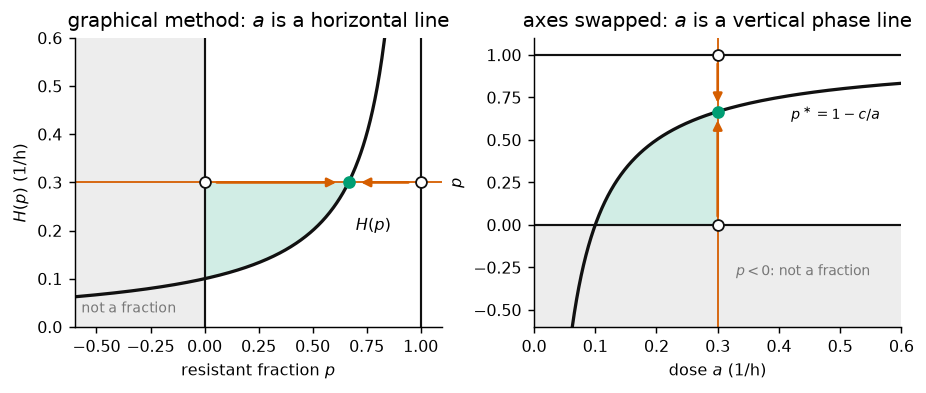
The same picture twice, for cost /h and dose /h. Left: the break-even dose and the line at height . Where the line lies above (shaded) the resistant fraction grows; the arrows of the phase line are drawn along the line, with filled circles for stable steady states and open ones for unstable. The vertical lines and are steady at every dose. Right: the axes swapped. The graph of is now the branch , the line at stands up as the phase line at that dose, and and lie flat. Repeating the right panel for every dose gives the left diagram below.
The picture also gives the stability. At the line crosses a rising graph, with growth to its left and decline to its right, so is stable wherever it is a fraction. In formulas, , and .
fig, axs = plt.subplots(1, 2, figsize=(7.2, 3.1), sharey=True)
A = np.linspace(0, 0.6, 400)
below, above = A <= c, A >= c
for ax in axs:
    ax.axhspan(-0.6, 0, color="0.93", zorder=0)
    ax.set_xlim(0, 0.6); ax.set_ylim(-0.6, 1.1)
    ax.set_xlabel("dose $a$ (1/h)")
    for a in (0.05, 0.3, 0.5):
        ax.plot([a, a], [0, 1], color="0.85", lw=0.8, zorder=1)

ax = axs[0]
ax.plot(A[below], 0 * A[below], color=C_EXACT, lw=2)
ax.plot(A[above], 0 * A[above], color=C_EXACT, lw=1.2, ls="--")
ax.plot(A, 1 + 0 * A, color=C_EXACT, lw=1.2, ls="--")
ax.plot(A[above], 1 - c / A[above], color=C_EXACT, lw=2)
A_neg = np.linspace(c / 1.6, c, 100)
ax.plot(A_neg, 1 - c / A_neg, color=C_EXACT, lw=1.2, ls="--")
for a in (0.05, 0.3, 0.5):
    flow_arrows(ax, lambda p, a=a: f_shared(p, a), shared_zeros(a), 0, 1,
                at=a, ms=9, lw=1.2)
ax.plot([c], [0], "o", color=C_INNER, ms=5, zorder=5)
ax.annotate("transcritical\nat $a = c$", xy=(c, 0), xytext=(0.13, -0.45),
            fontsize=8, color=C_INNER)
ax.text(0.33, -0.3, "$p < 0$: not a fraction", fontsize=7.5, color="#777777")
ax.text(0.36, 0.55, r"$p^\ast = 1 - c/a$", fontsize=8)
ax.set_ylabel("steady states $p$")
ax.set_title(r"shared good: $p^\ast$ rises from $0$")

ax = axs[1]
ax.plot(A[below], 0 * A[below], color=C_EXACT, lw=2)
ax.plot(A[above], 0 * A[above], color=C_EXACT, lw=1.2, ls="--")
ax.plot(A[below], 1 + 0 * A[below], color=C_EXACT, lw=1.2, ls="--")
ax.plot(A[above], 1 + 0 * A[above], color=C_EXACT, lw=2)
ax.plot([c, c], [0, 1], color=C_INNER, lw=2, alpha=0.6)
for a in (0.05, 0.3, 0.5):
    flow_arrows(ax, lambda p, a=a: (a - c) * p * (1 - p), [0, 1], 0, 1,
                at=a, ms=9, lw=1.2)
ax.annotate("every $p$ is\nsteady at $a = c$", xy=(c, 0.5), xytext=(0.12, 0.4),
            fontsize=8, color=C_INNER)
ax.set_title("no sharing: the outcome jumps")
fig.tight_layout();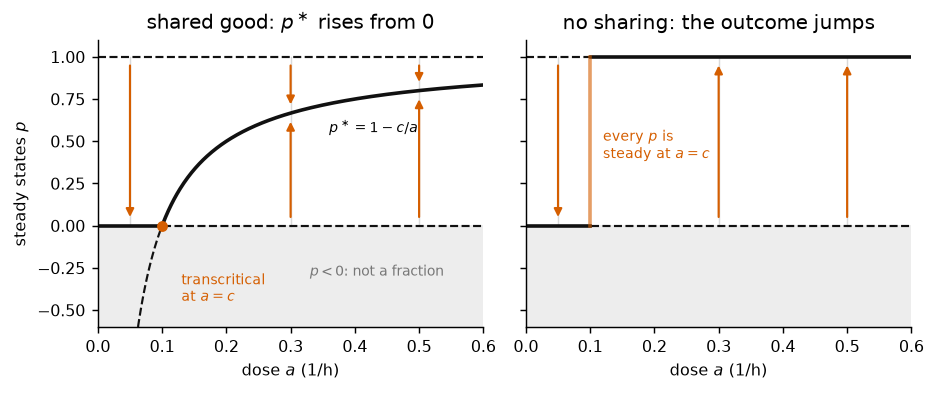
Bifurcation diagrams in the dose , for cost /h. Solid: stable. Dashed: unstable. The vertical arrows are the phase lines at , 0.3 and 0.5/h. Left: the shared-good model (1). The branch comes up through at , and the two exchange stability. Right: the model without sharing, . The outcome jumps from to as the dose passes .
The transcritical bifurcation
Proposition 1 (A transcritical bifurcation at the cost)
Proof 1
is negative for , zero at , and in for . The stability follows from the signs of the slopes (3) and the slope test (Proposition 1): changes sign from negative to positive at , and changes sign from positive to negative. The approximation uses in the denominator.
This is called a transcritical bifurcation: two branches of steady states cross at the critical value, and each passes its stability to the other.
As biology: below , the drug kills sensitive cells more slowly than the enzyme slows resistant ones, and resistance is lost from any mixture. Above , resistance persists, at a level that starts at zero and rises with the dose. At no dose do the sensitive cells vanish.
Without sharing
Without sharing, for example when resistant cells pump the drug out of themselves without lowering the level in the culture, the difference of rates is the constant , and . The right panel above shows its bifurcation diagram. Below the resistant cells are lost; above it they take over completely. At exactly the right-hand side is zero for every , so every mixture is a steady state.
A whole segment of steady states at a single parameter value needs the rates of the two types to be exactly equal for every . The smallest dependence of the rates on breaks it. With a little sharing, with small , the transcritical bifurcation returns, and the interior steady state crosses over the window of doses , which shrinks to a point as .
Resistance at low doses
The minimum inhibitory concentration (MIC) of an antibiotic is the smallest dose that stops the growth of a sensitive strain. Doctors choose doses above it. In our model sensitive cells grow at , so the MIC is the dose with .
Resistance persists above . The cost of resistance is small compared with the growth rate, , so this threshold lies far below the MIC: doses too small to treat anything still keep resistant cells in the population. The threshold is the same with or without sharing; sharing decides only what happens above it. Gullberg and colleagues competed resistant and sensitive bacteria at very low drug concentrations and found that resistant cells were enriched at concentrations up to several hundred times below the MIC Gullberg et al., 2011.
Critical slowing down
At the slope at is zero, and near
The phase line says is stable, but the decay is slow: separating variables in gives , a power of instead of an exponential.
Near the bifurcation value the approach is exponential again, but slow. The time scale is at the stable steady state, from (3):
and both grow without bound as .
Remark 2 (Critical slowing down)
Near a bifurcation the system takes a long time to settle, because the arrows on the phase line near the steady state are short. This is critical slowing down. In an experiment, a culture near that is followed for a day has not reached its steady state, and the fraction measured at the end is not .
Saddle-Node Bifurcation: The Inoculum Effect turns the same dose in a model that counts cells instead of fractions, and finds a second kind of bifurcation.
- Gullberg, E., Cao, S., Berg, O. G., Ilbäck, C., Sandegren, L., Hughes, D., & Andersson, D. I. (2011). Selection of resistant bacteria at very low antibiotic concentrations. PLoS Pathogens, 7(7), e1002158. 10.1371/journal.ppat.1002158