import numpy as np
import scipy.linalg as LA
import matplotlib.pyplot as plt
Stability of Gaussian Elimination
This notebook explores the numerical stability of Gaussian elimination with partial pivoting by computing growth factors for random matrices and examining the structure of the LU factors.
Based on the discussion in Trefethen and Bau, Numerical Linear Algebra (SIAM, 1997), Lectures 22 and 23.
Growth Factors in LU Decomposition with Partial Pivoting
Let’s compute some growth factors of random matrices. We carry out LU decomposition of the matrix with partial pivoting, giving .
The growth factor is defined as:
The maximal possible growth factor is , but this is extremely rare. Below we compute typical growth factors for random matrices and observe that they grow much more slowly (roughly as ).
ns = np.unique(np.ceil(np.logspace(0, 3, 150))).astype(int)

# number of matrices to generate
M = 20

# Normal
mu    = 0.0
stdev = 100.0

rhos = np.empty((M * ns.size, 2), dtype=float)
for i, n in enumerate(ns):
    for k in range(M):
        A = np.random.normal(mu, stdev, size=n**2).reshape((n, n))
        p, l, u = LA.lu(A)

        # Compute growth factor
        rho = np.max(np.abs(u)) / np.max(np.abs(A))
        rhos[i * M + k, 0] = n
        rhos[i * M + k, 1] = rho
fig, ax = plt.subplots()
ax.scatter(rhos[:, 0], rhos[:, 1], s=2)
ax.plot(ns, np.sqrt(ns), color='k', ls='--', label=r'$\sqrt{n}$')
ax.set_xscale('log')
ax.set_yscale('log')
ax.set_xlabel('Matrix dimension $n$')
ax.set_ylabel(r'Growth factor $\rho$')
ax.set_title('Growth factors of random matrices with partial pivoting')
ax.legend()
plt.tight_layout()
plt.show()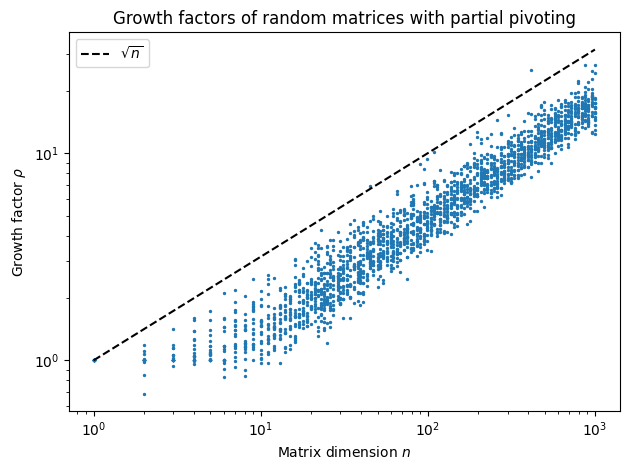
N = 128
mu = 0.0
stdev = 100.0
A = np.random.normal(mu, stdev, size=N**2).reshape((N, N))
p, l, u = LA.lu(A)
q, r = LA.qr(A)

linv = LA.inv(l)
max_l = np.max(np.abs(linv))

fig, axs = plt.subplots(2, 2, figsize=(10, 10))
title = r'$\max_{ij} |(L^{-1})_{ij}| = $' + f'${max_l:.2f}$'
axs[0, 0].set_title(title)
axs[0, 0].spy(linv, precision=1.0 - np.finfo(float).eps)

axs[1, 0].set_title('Random $A$')
axs[1, 0].spy(np.abs(q), precision=1.0 / np.sqrt(N) - np.finfo(float).eps)

# Now create random lower triangular matrix with random signs
stdev = 1.0
A_rand = np.random.normal(mu, stdev, size=N**2).reshape((N, N))
np.fill_diagonal(A_rand, 1.0)
A_rand = np.tril(A_rand)

signs = (-1) ** (np.random.randint(1, 3, size=(N, N)))
A_signed = signs * l
linv2 = LA.inv(A_signed)
q2, r2 = LA.qr(A_signed)
max_l2 = np.max(np.abs(linv2))

title = r'$\max_{ij} |(L^{-1})_{ij}| = $' + f'${max_l2:.2g}$'
axs[0, 1].set_title(title)
axs[0, 1].spy(linv2, precision=1.0 - np.finfo(float).eps)

axs[1, 1].set_title('Random $L$')
axs[1, 1].spy(np.abs(q2), precision=1.0 / np.sqrt(N) - np.finfo(float).eps)

fig.tight_layout()
plt.show()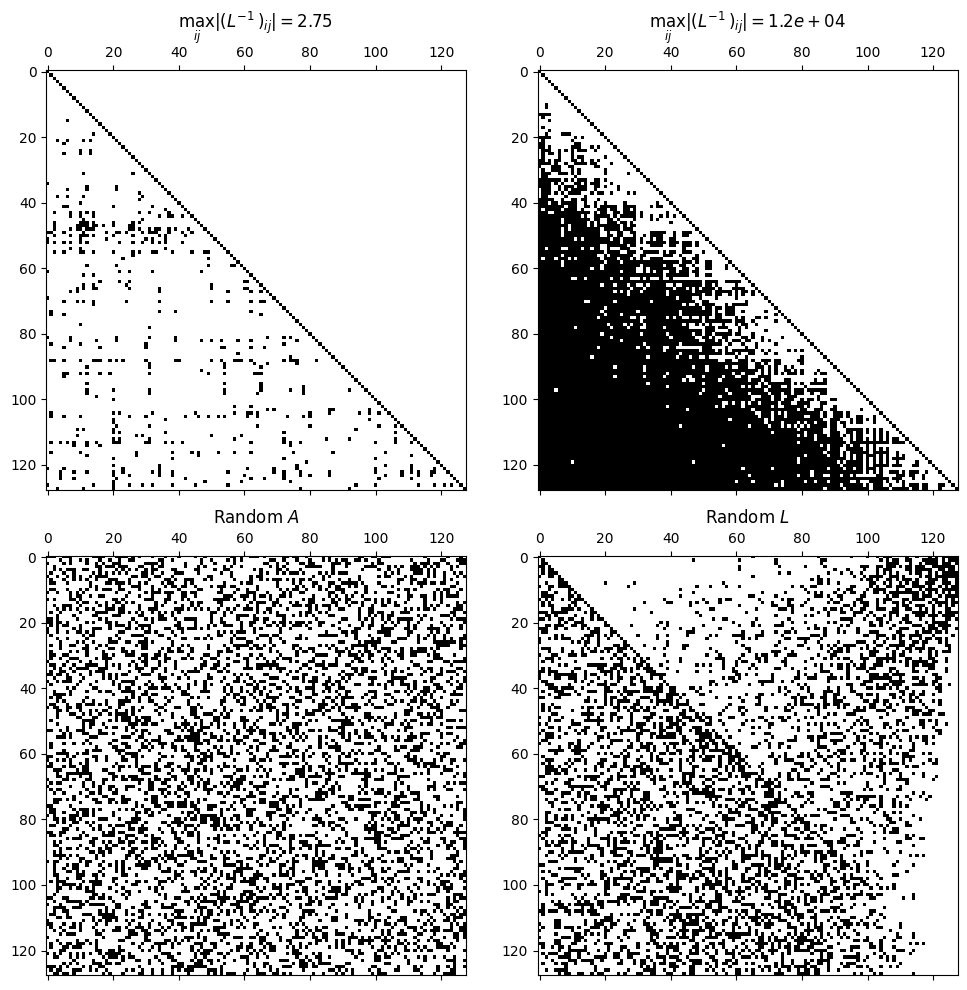
fig, ax = plt.subplots()
ax.set_title(r'Sparsity pattern of $|Q|$ from QR of random $A$')
ax.spy(np.abs(q), precision=1.0 / np.sqrt(N) - np.finfo(float).eps)
plt.show()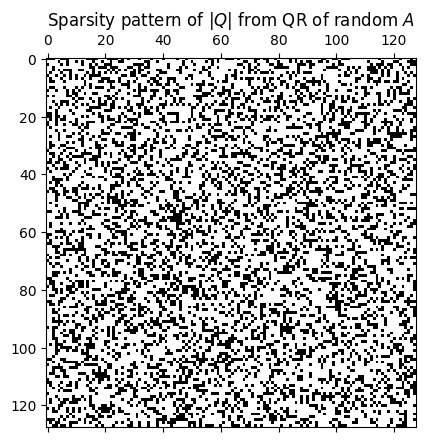
# Random lower triangular matrix
N = 128
stdev = 1.0
A = np.random.normal(0.0, stdev, size=N**2).reshape((N, N))
np.fill_diagonal(A, 1.0)
A = np.tril(A)
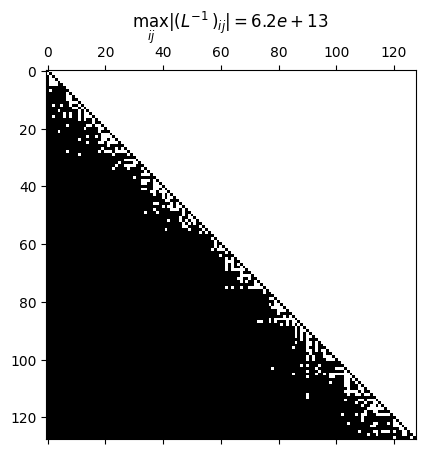
linv = LA.inv(A)
max_l = np.max(np.abs(linv))
fig, ax = plt.subplots()
title = r'$\max_{ij} |(L^{-1})_{ij}| = $' + f'${max_l:.2g}$'
ax.set_title(title)
ax.spy(linv, precision=1.0 - np.finfo(float).eps)
plt.show()/tmp/ipykernel_3271/3185684298.py:8: LinAlgWarning: An ill-conditioned matrix detected: slice 0 has rcond = 4.770158550348202e-17.
linv = LA.inv(A)
q, r = LA.qr(A)

fig, ax = plt.subplots()
ax.set_title(r'Sparsity pattern of $|Q|$ from QR of random $L$')
ax.spy(np.abs(q), precision=1.0 / np.sqrt(N) - np.finfo(float).eps)
plt.show()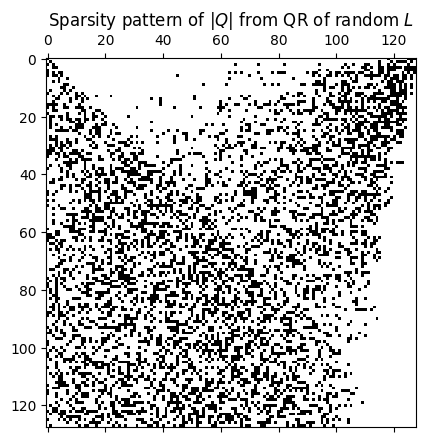
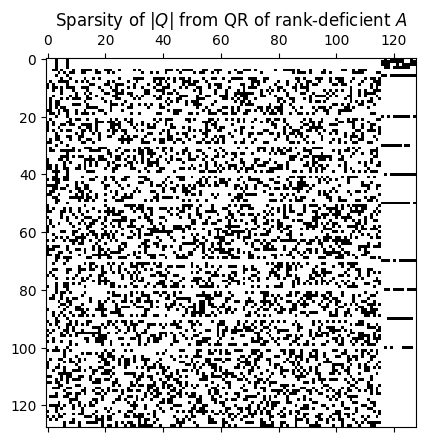
N = 128
A = np.random.normal(0.0, 1.0, size=N**2).reshape((N, N))
# Make some rows identical (rank-deficient)
for idx in [0, 2, 3, 6, 20, 30, 40, 50, 70, 80, 90, 100]:
    A[idx, :] = A[1, :]

q, r = LA.qr(A)

fig, ax = plt.subplots()
ax.set_title(r'Sparsity of $|Q|$ from QR of rank-deficient $A$')
ax.spy(np.abs(q), precision=1.0 / np.sqrt(N) - np.finfo(float).eps)
plt.show()